As a software engineer, I eventually need to collect metrics from my development environment to be graphed and measured. I found a very portable solution based on Docker containers, InfluxDB as time series store and Grafana as visualization tool.
Let’s start by installing the Docker environment in Mac OS X:
Installing Docker
VirtualBox
In OS X, Docker containerization process is based on a Virtual Machine image (boot2docker.iso), so you would need to have VirtualBox installed:
$ brew cask install virtualbox
docker-machine
After that, let’s install the docker client and docker-machine interface:
$ brew install docker docker-machine
To create a new development machine using the VirtualBox driver:
$ docker-machine create --driver virtualbox dev
Run this command to set all needed environment variables to run Docker containers:
$ eval "$(docker-machine env dev)"
As you see, this output can be fetched by using the following command, so all these environment variables can be exported manually in case you need:
$ docker-machine env dev
Docker Hub
You need to be registered and logged in Docker Hub to be able to download and run any registered containers. You can create your account directly on Docker Hub website or by running this command:
$ docker login
Just to test your Docker environment, you can run the hello-world container this way:
$ docker run hello-world
If you get this output, it’s working fine:
[...]

Hello from Docker.
This message shows that your installation appears to be working correctly.
Containers
I chose InfluxDB as data store for Grafana, which is a great metrics dashboard and graph editor.
Here’re the containers we will be running in the following steps:
InfluxDB container
Now that your Docker environment is ready, run this command to download and start the tutum/influxdb container and pre-create a testing database named wadus:
docker run -d -p 8083:8083 -p 8086:8086 \
  -e PRE_CREATE_DB="wadus" \
  --expose 8090 --expose 8099 \
  --name influxdb \
  tutum/influxdb
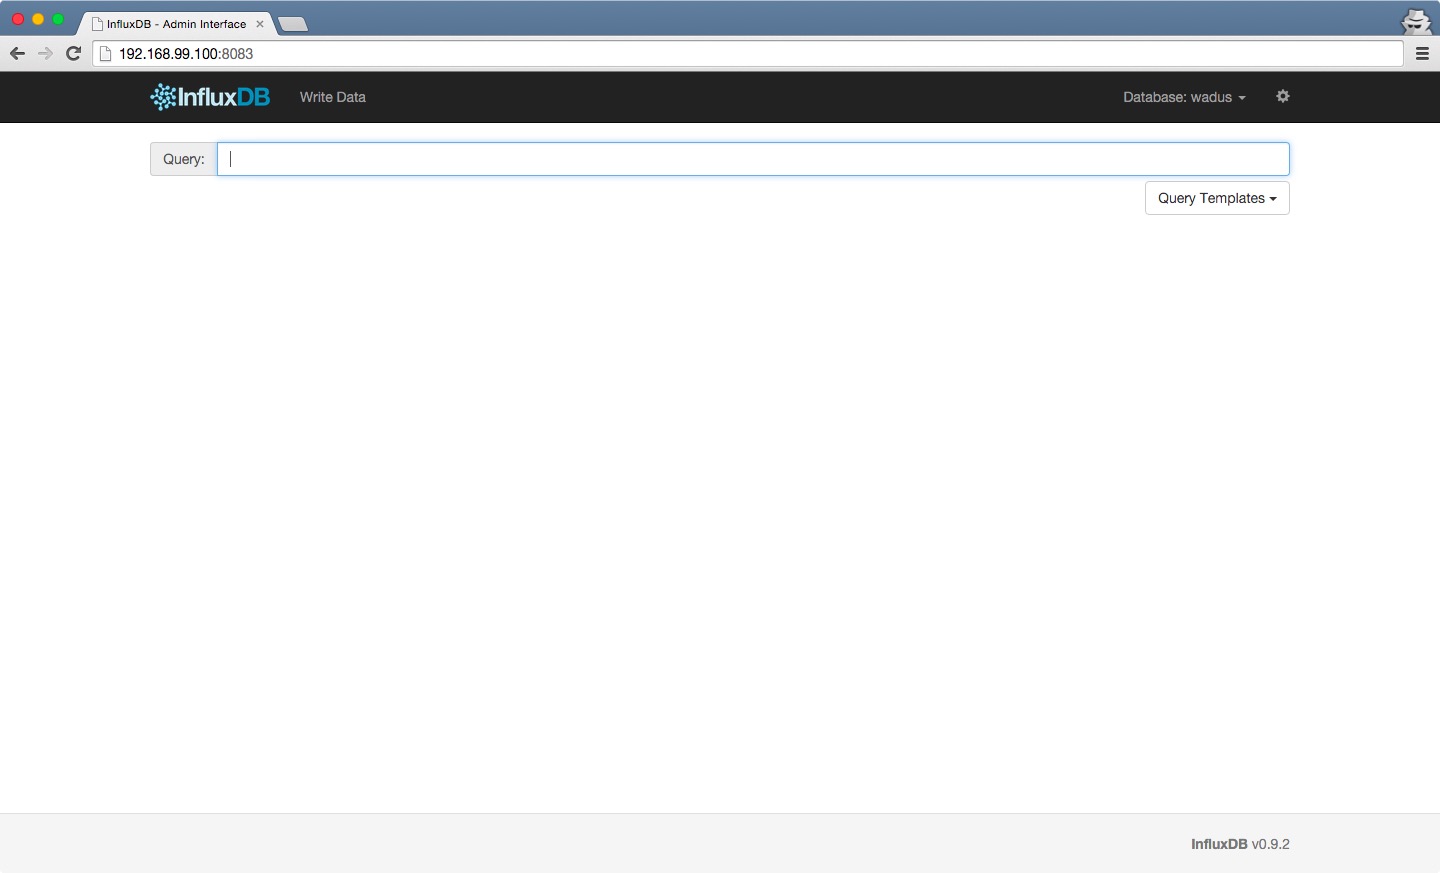
After having checked that the Docker process is running (docker ps) and the container output looks fine (docker logs influxdb), you can reach the InfluxDB Admin page at port 8083:
http://<your_docker_host_ip>:8083/
Or, to dynamically get your Docker host IP and open that URL in your default browser, you can just run:
$ open http://$(docker-machine ip dev):8083
Grafana container
Let’s run the Grafana Docker process linked with the influxdb one:
docker run -d -p 3000:3000 \
  --link influxdb:influxdb \
  --name grafana \
  grafana/grafana
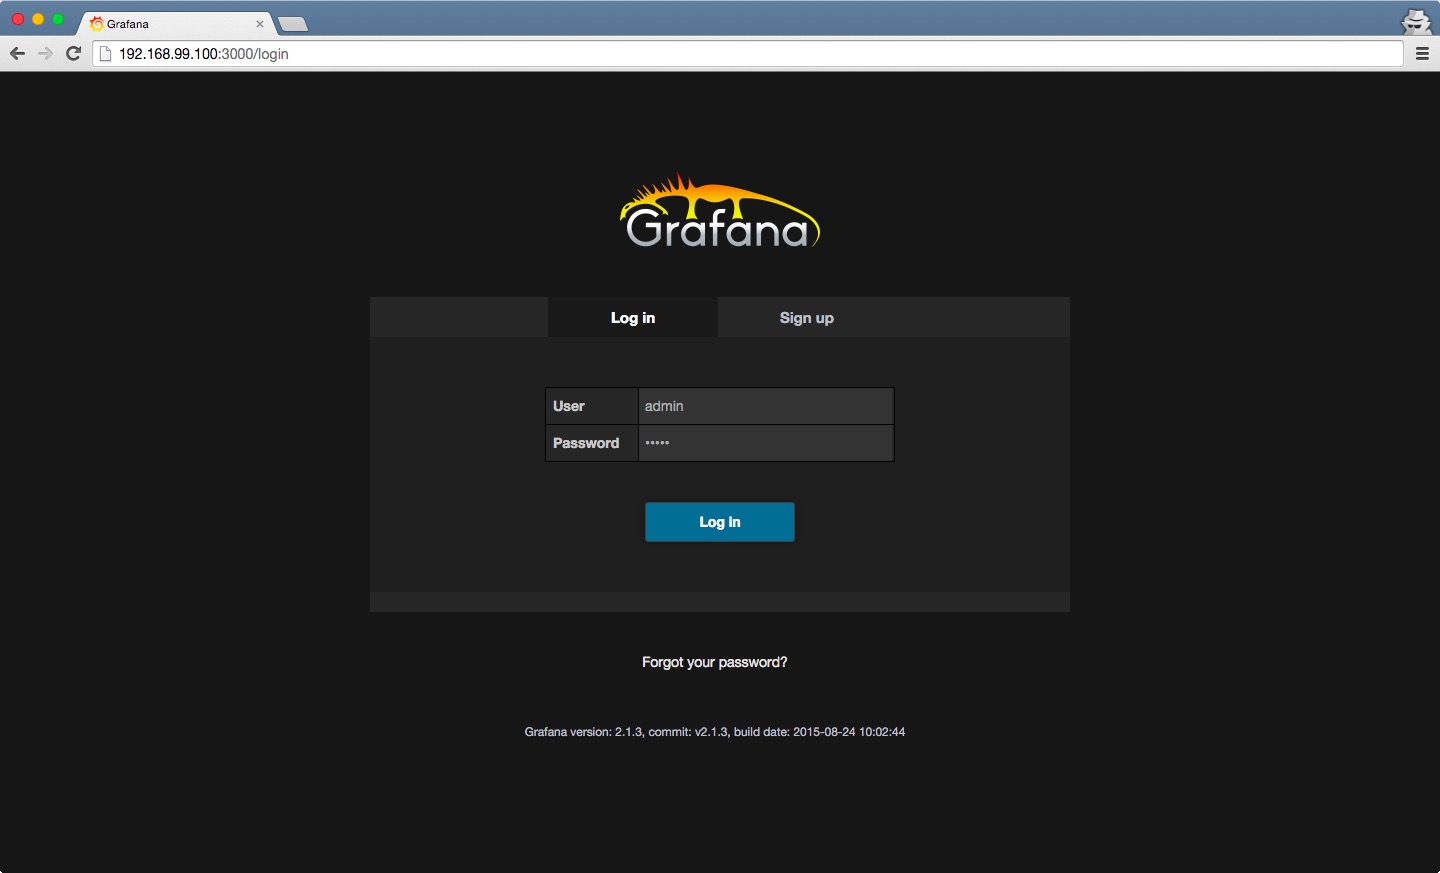
So we now have a Grafana web UI at port 3000. Just open this URL in your browser:
http://<your_docker_host_ip>:3000/
Or run:
$ open http://$(docker-machine ip dev):3000
You can login there by using admin as username and password:
Load InfluxDB with data
You would need to load your data at this point. There’re clients for several languages, I will use the official Ruby client as I’m eventually integrating it in some of my Ruby apps. Its usage is quite simple as well:
require "influxdb"

module InfluxDB
  module Playground
    class Populator
      HOST     = "192.168.99.100"
      PORT     = "8086"
      DATABASE = "wadus"
      USER     = "root"
      PASSWORD = "root"

      def write_data_points
        client.write_points(data_points)
      end

      private

      def client
        @client ||= InfluxDB::Client.new(
          host: HOST,
          port: PORT,
          database: DATABASE,
          user: USER,
          password: PASSWORD
        )
      end

      def data_points
        [
          {
            series: "score",
            values: { value: rand(200) }
          },
          {
            series: "searches",
            values: { value: rand(200) }
          }
        ]
      end
    end
  end
end

# populator = InfluxDB::Playground::Populator.new
# populator.write_data_points
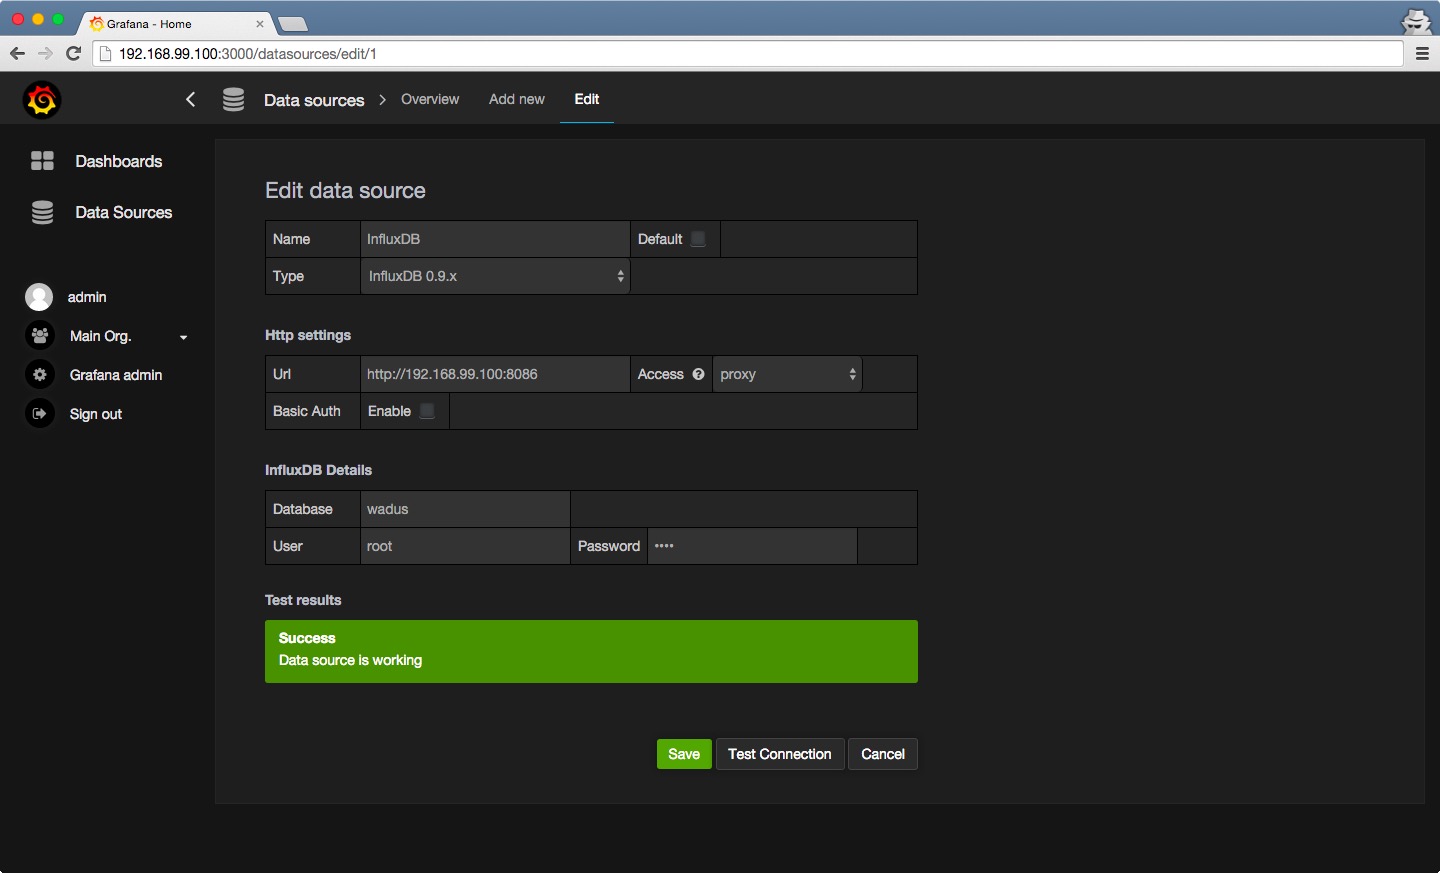
Add InfluxDB data source in Grafana
To access your time series from Grafana, you need to set up the InfluxDB server as a data source. The InfluxDB HTTP API runs on 8086 port, so just remember to set your Docker host IP as part of the URL:
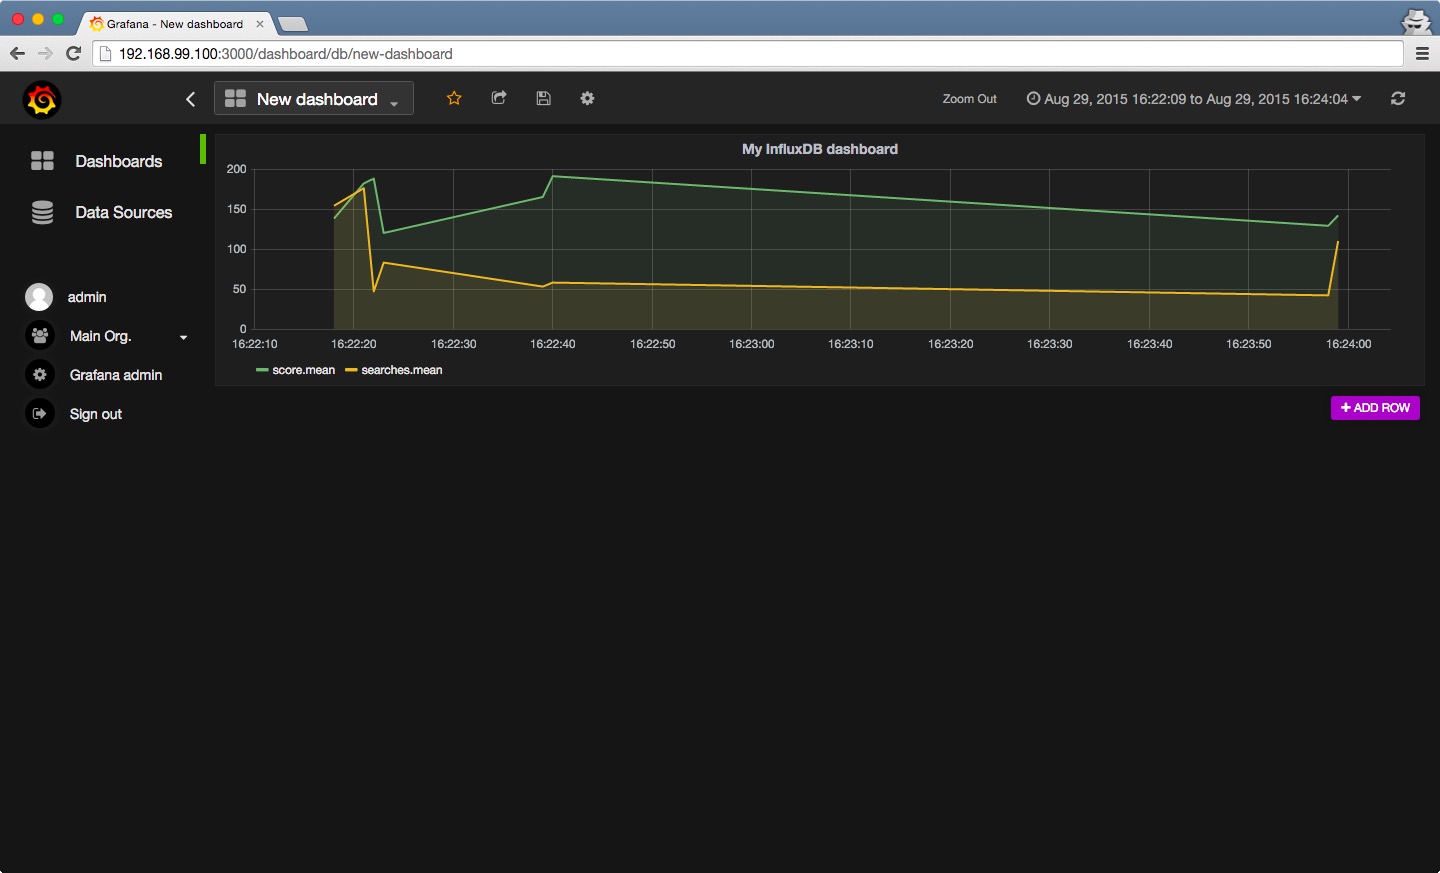
Create Grafana dashboard
Now that Grafana can access InfluxDB HTTP API, you are finally ready to create a Dashboard and visualize your data. As you see, all your InfluxDB database measurements are available to be used on graph queries:
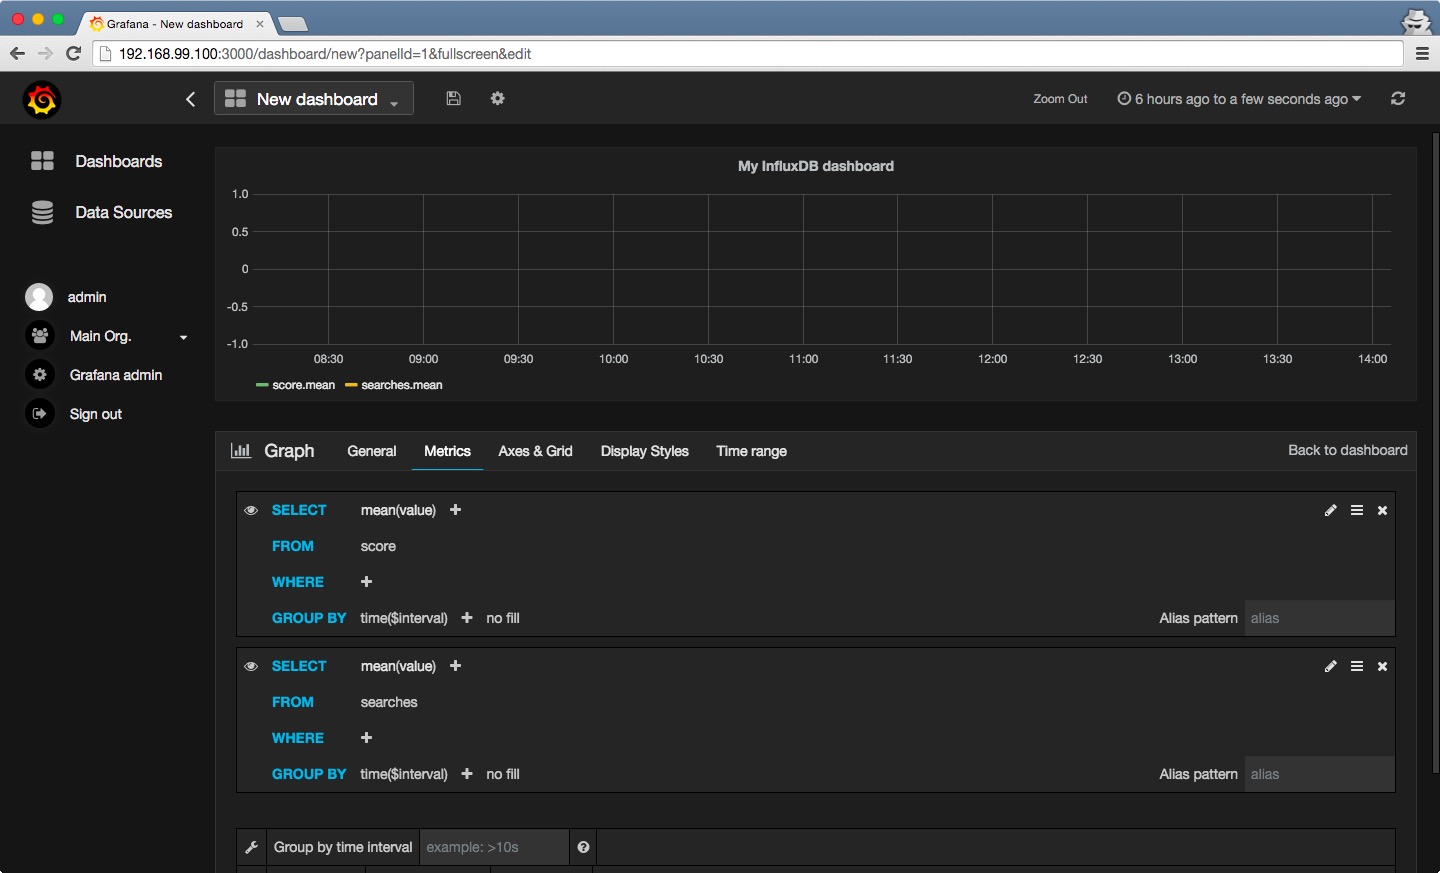
So it’s time to play with your Dashboard and collected data:
That’s all. Your environment is isolated as Docker processes and can be recreated at any time. Now you can see the currently running Docker containers and stop or destroy them:
$ docker ps

CONTAINER ID        IMAGE               COMMAND                  CREATED             STATUS              PORTS                                                                NAMES
aaea0c5ac8e9        grafana/grafana     "/usr/sbin/grafana-se"   28 hours ago        Up About an hour    0.0.0.0:3000->3000/tcp                                               grafana
f6451be21c8f        tutum/influxdb      "/run.sh"                45 hours ago        Up About an hour    0.0.0.0:8083->8083/tcp, 8090/tcp, 8099/tcp, 0.0.0.0:8086->8086/tcp   influxdb
To stop grafana and influxdb containers:
$ docker stop grafana influxdb
And finally, to stop the Docker machine:
$ docker-machine stop dev
I hope you find this article handy ;)